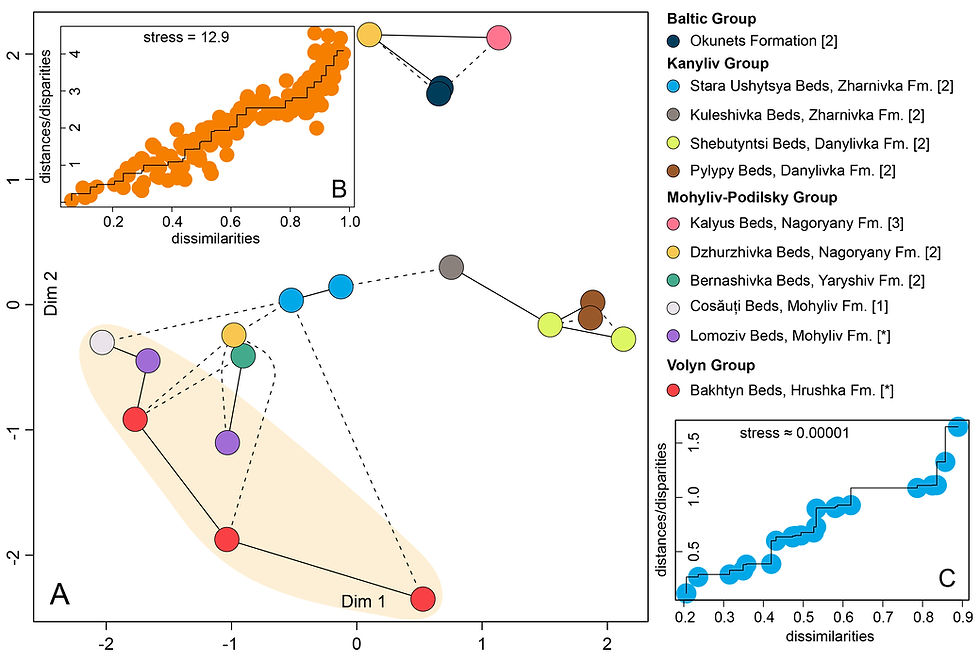
Detrital zircon MDS analysis
- frankovski
- Mar 30, 2024
- 1 min read
To perform Multi-dimensional scaling (MDS) using the Kolmogorov-Smirnov method for detrital zircon data from an Excel file with detrital zircon data, Python can be used along with libraries such as pandas, scipy, and scikit-learn.
The code for the MDS statistical analysis is as follows:
import pandas as pd
from sklearn.manifold import MDS
from sklearn.neighbors import NearestNeighbors
import numpy as np
import matplotlib.pyplot as plt
from mpl_toolkits.mplot3d import Axes3D

# Read data from Excel file
file_path = 'MDS.xlsx'
data = pd.read_excel(file_path)

# Remove NaN values and transpose data
data = data.dropna().transpose()

# Perform MDS
mds = MDS(n_components=3, dissimilarity='euclidean', random_state=42)
mds_coordinates = mds.fit_transform(data)

# Find nearest neighbors
num_neighbors = 2
nbrs = NearestNeighbors(n_neighbors=num_neighbors + 1, algorithm='ball_tree').fit(mds_coordinates)
distances, indices = nbrs.kneighbors(mds_coordinates)

# Plot MDS result in 3D
fig = plt.figure(figsize=(15, 8), facecolor='white')  # Set background color to white
ax = fig.add_subplot(111, projection='3d')

# Scatter plot
ax.scatter(mds_coordinates[:, 0], mds_coordinates[:, 1], mds_coordinates[:, 2], alpha=0.5, s=100)  # increased circle size (s parameter)

# Annotate points with sample names
for i, txt in enumerate(data.index):
    ax.text(mds_coordinates[i, 0], mds_coordinates[i, 1], mds_coordinates[i, 2], txt)

# Plot lines between nearest neighbors
for i in range(len(mds_coordinates)):
    for j_idx, j in enumerate(indices[i][1:]):  # Exclude the first index as it's the point itself
        line_style = '-' if j_idx == 0 else '--'
        line_color = 'black' if j_idx == 0 else 'gray'
        ax.plot([mds_coordinates[i, 0], mds_coordinates[j, 0]],
                [mds_coordinates[i, 1], mds_coordinates[j, 1]],
                [mds_coordinates[i, 2], mds_coordinates[j, 2]],
                linestyle=line_style, color=line_color, alpha=0.5)

ax.set_title('Multi-dimensional Scaling for Detrital Zircon Data with Nearest Neighbors')
ax.set_xlabel('MDS Component 1')
ax.set_ylabel('MDS Component 2')
ax.set_zlabel('MDS Component 3')

# Set background color of the cube to white
ax.w_xaxis.line.set_color('white')
ax.w_yaxis.line.set_color('white')
ax.w_zaxis.line.set_color('white')

plt.show()


Comments